Getting Started with Data Studio
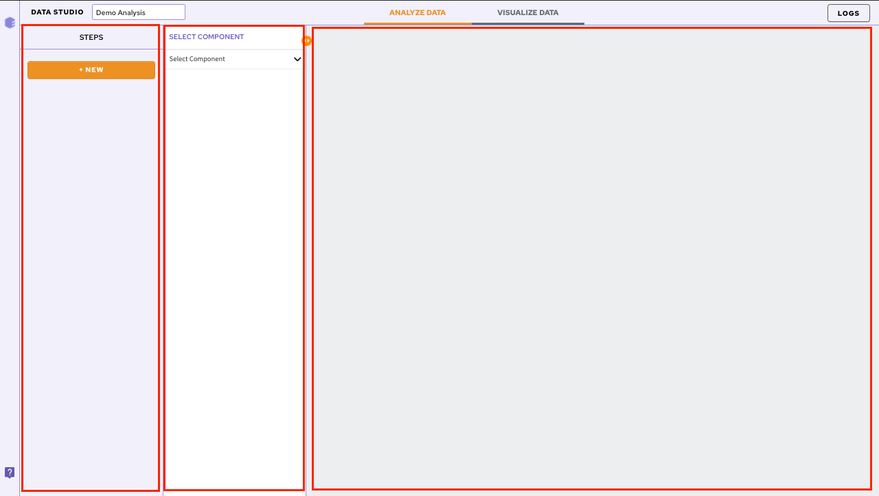
The Studio Core has three main panels:
-
Component Panel: Displays a list of all the steps/components selected in this particular session
-
Parameters Panel: Allows you to select the component and input files
-
Visualization Panel: Displays the selected visualization plot along with visualization parameters
Add and Configure Components
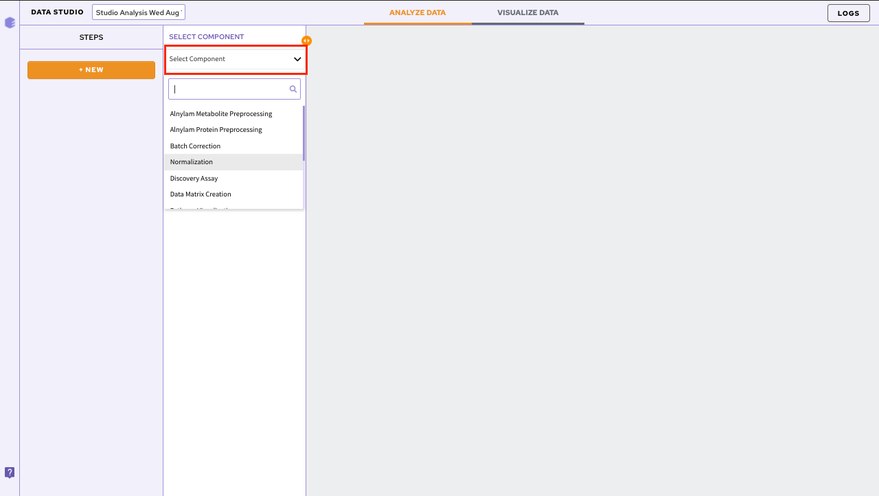
In order to add a component to your workflow, click on the Select Component option present in the parameter panel. You can select the desired component from the dropdown menu. You can search for the component as well from the search option.
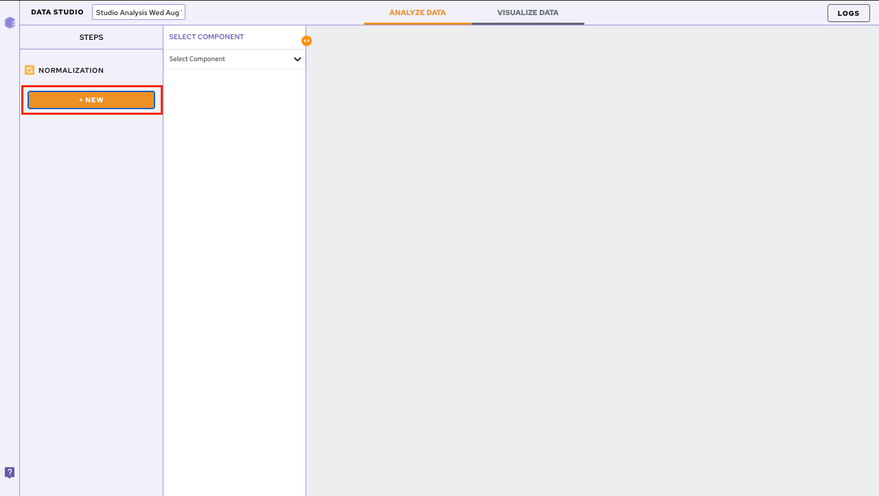
To add subsequent components, Click on the NEW option present in the component panel.
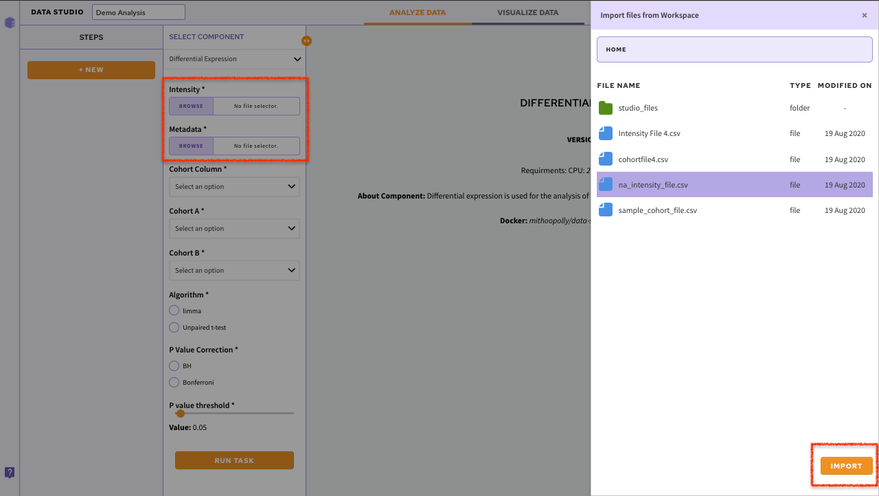
Adding Input Files
Once a component is selected it is required to add the input files. In order to do that, click on the Browse option. A slide menu will appear displaying the data files present in the selected workspace. Select the file and click on Import. Your file will be added.
Note:
- Input files are not required to be added at each step. They automatically get mapped from the previous component.
Executing the Components
Each component comes with its associated parameters that are displayed in the parameter panel. Fill in all the mandatory fields using the dropdown menu or using the checkboxes. Once the parameters are specified, click on the Run Task option to execute your component.
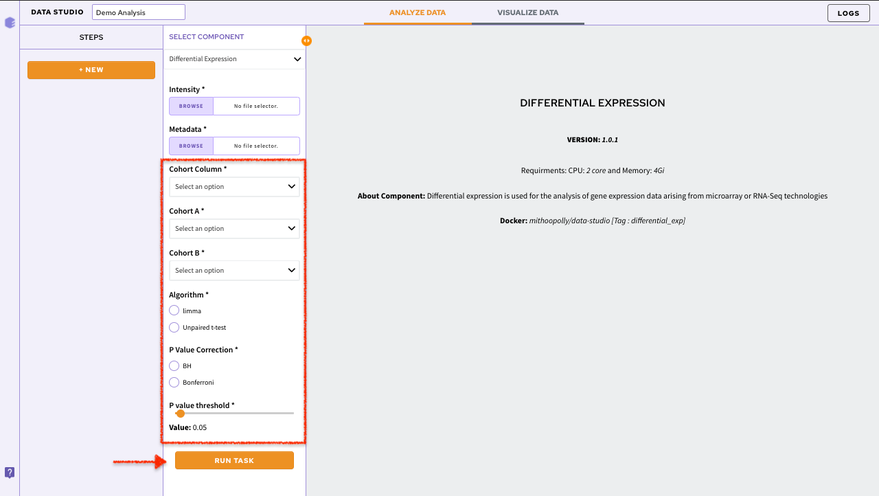
You can have a look at the state of your execution with the displayed status bar.
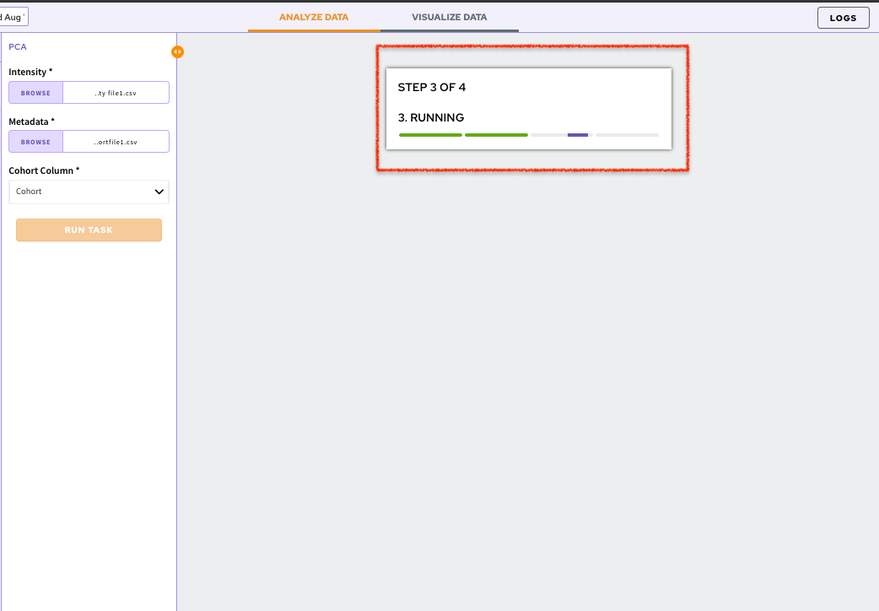
The default visualization of the component will be generated on the Visualization Panel.
Chart Selection
If there are multiple visualizations for a particular component, you can use the Select a Chart option to choose the visualization you want displayed on your screen. At a time only a single visualization can be displayed on the Visualization Panel.
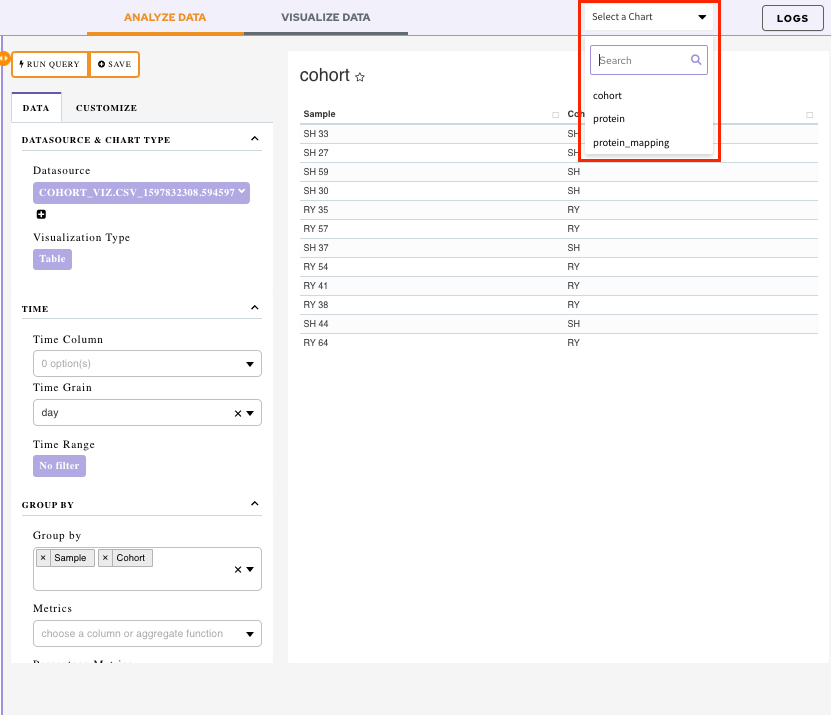
In order to look at all the visualization simultaneously, save your visualization to a dashboard.
Other Useful Features
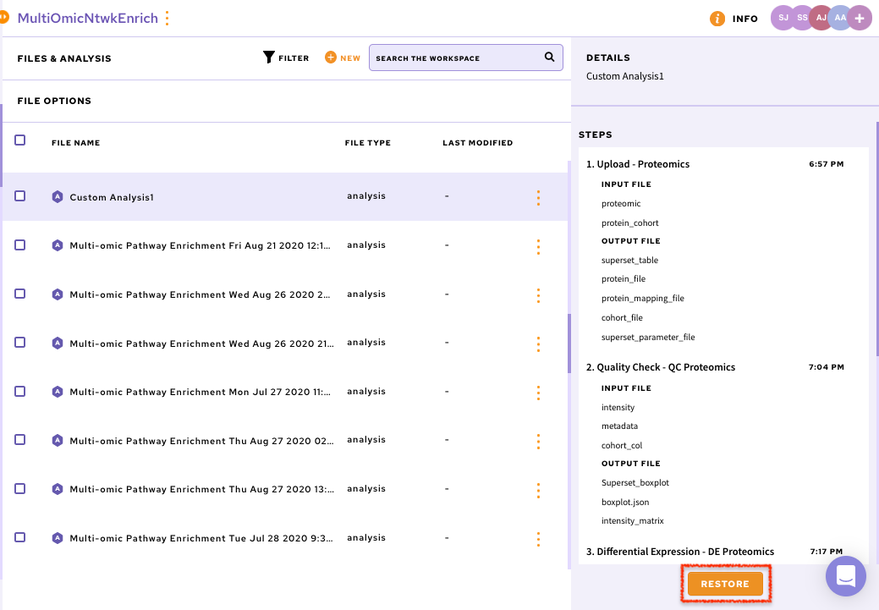
Restoring the analysis
You can restore your analysis at any point in time. Data Studio contains the restore functionality that allows any analysis to be restored to the last step. Analyses can be restored by navigating to the desired workspace.
Click on the specific analysis which will enable the Restore option on the right panel. Clicking on Restore will take you back to the application with the same data used before.
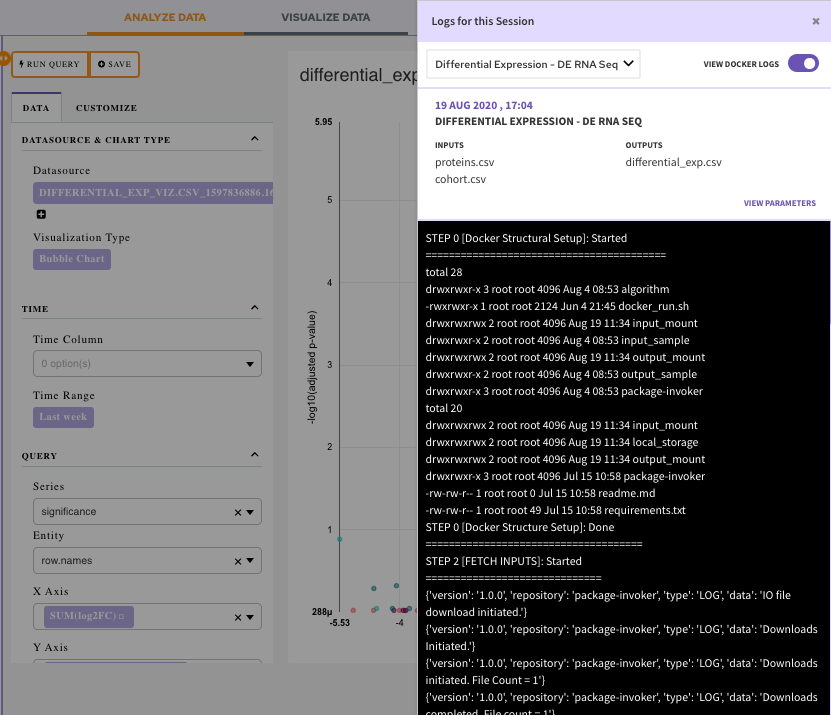
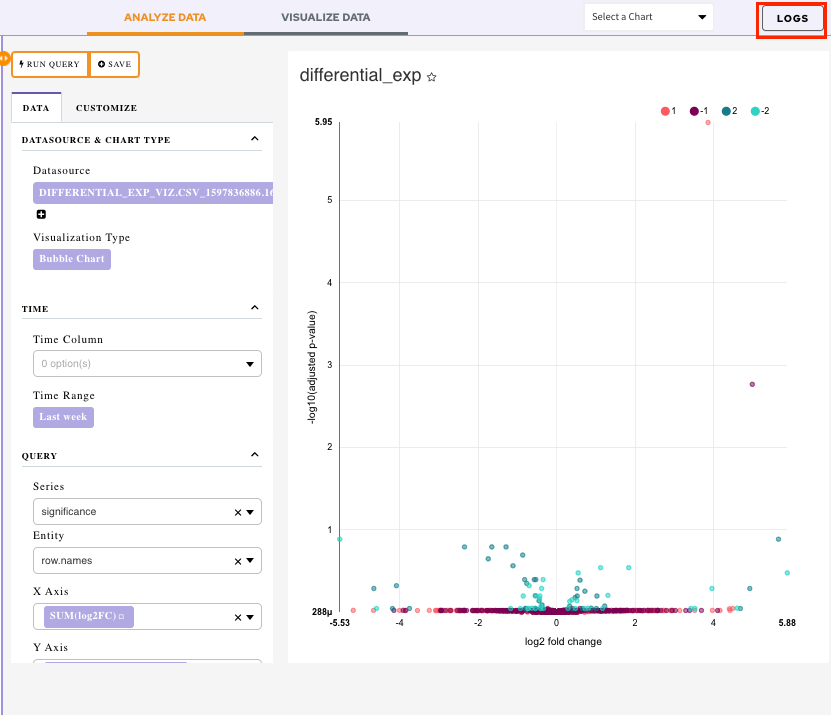
Accessing the logs
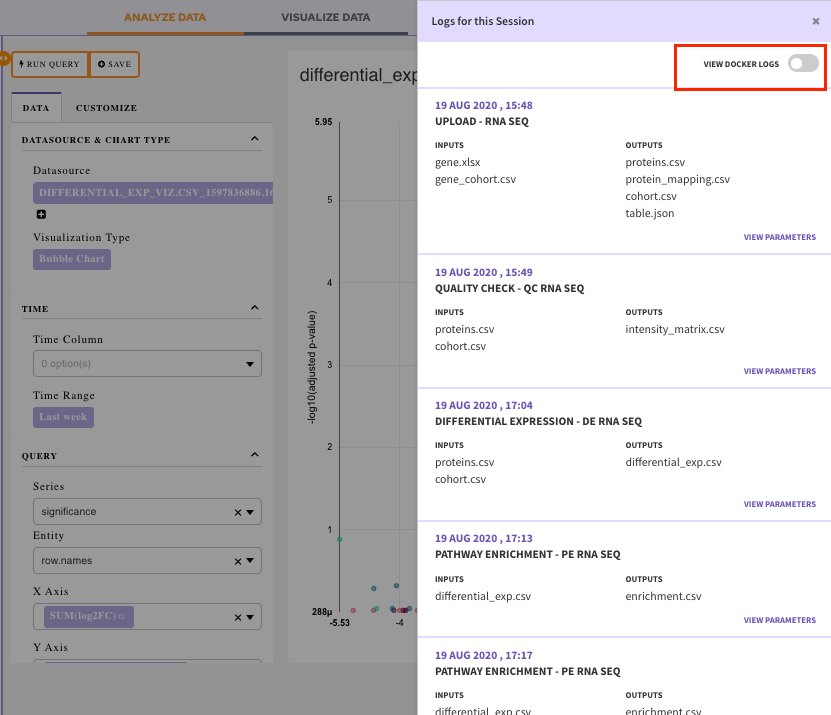
The log option present at top right corner of the screen allows you to look at the logs of the current session. You can look at the input files uploaded, the output files generated as well as the parameters used in this session.
View Docker Logs: Enable View Docker Logs option to view the execution of the component on the code level.
Select a job for which you want the logs from the drop-down menu.
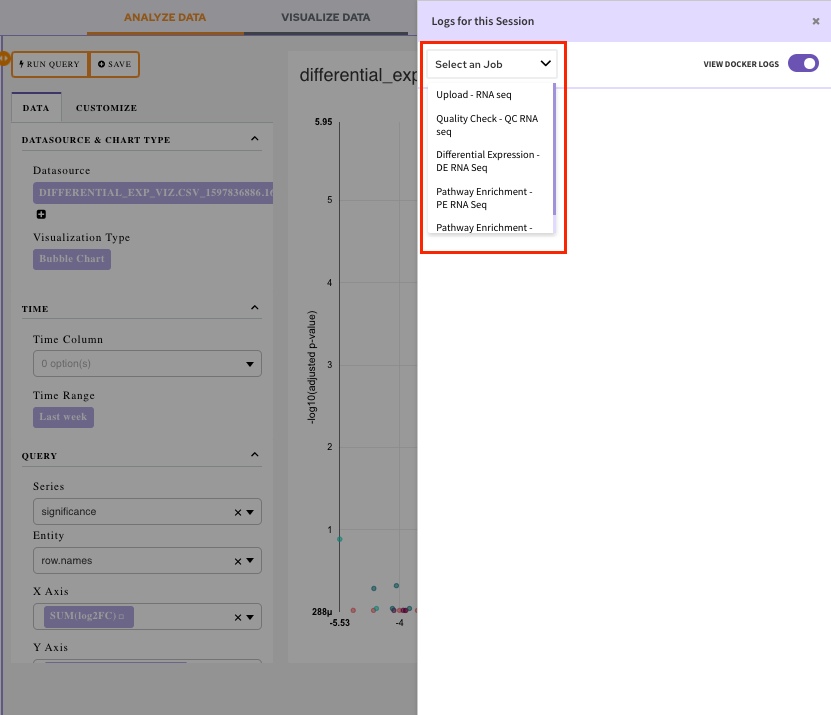
Once the job is selected, you will be able to visualize the docker logs. It will let you know what is happening, or what happened at every layer of the stack.